As an entrepreneur, your business probably generates a lot of data. Customer information, sales transactions, website analytics, and social media metrics are frequently top of mind among new business owners. However, your data can be used far beyond common marketing and advertising examples. In this post, you’ll find several common business problems you can solve with data to improve your decision-making.
Common Business Problems
An exhaustive list of common business problems you can solve with data is beyond the scope of this article. Instead, I’ll focus on going a bit deeper with a shorter list to highlight how to approach data problems.
The list of methods I’ll focus on includes:
- Customer Segmentation
- Sales Forecasting
- Minimizing Maintenance Downtime
- Process Efficiency
- Customer Feedback
Customer Segmentation
Segmentation is the process of grouping diverse units (in this case, people) into smaller groups of similar units. Customer segmentation helps target your marketing message when your customers have distinct perspectives and motivations to buy. Dividing your customers into distinct groups based on factors influencing buying decisions allows you to speak more effectively to each subgroup.
Customer segmentation is a common business problem so obvious that we overlook it. A perfect example is the way clothing retailers separate their sites into pages for men’s and women’s clothing. Go to a fashion retailer like Nordstrom.com and look at the main clothing page for women and men.
On the women’s page, you’ll find a seasonal sponsored advertisement, followed by popular clothing categories pitched toward a wardrobe refresh.

On the men’s page, you’ll find information about how easy curbside pickups and returns are. Nordstrom follows that by immediately presenting specific clothing items for sale.
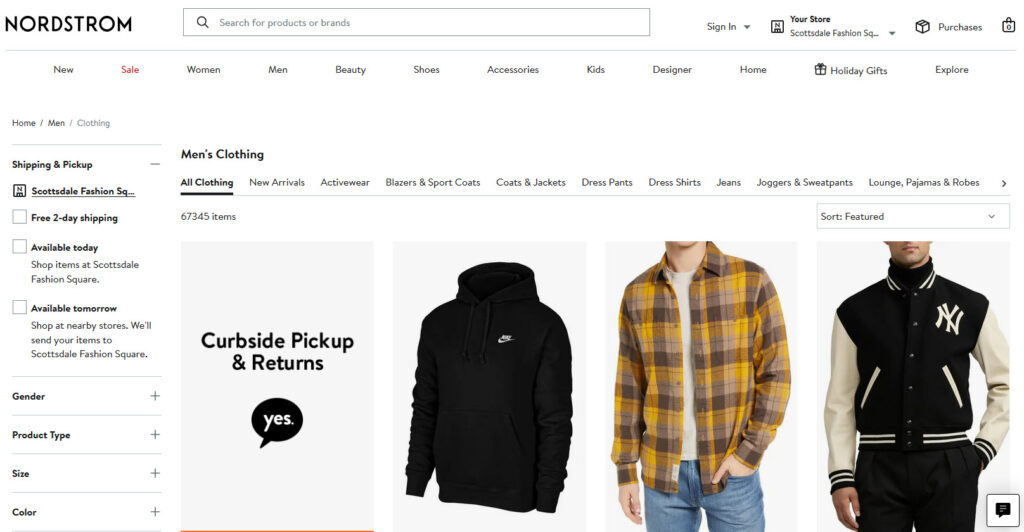
Clearly, these are two different approaches to retail clothing sales, aimed at how men and women approach shopping.
You can perform customer segmentation with more than just gender differences. You can choose various traits to segment an audience, sometimes combining multiple traits.
Common ways you might choose to segment customers include:
- Demographics: gender, age, income, education, marital status
- Behavior: shopping habits, purchase frequency, loyalty, product usage
- Psychographic: beliefs, values, opinions, interests, lifestyle choices
- Geographic: by country, state, city, or neighborhood of residence
Start by identifying subgroups of customers who relate to and interact with your products differently. Then use these differences to tailor your messaging to each group of individuals.
Your customers will feel a closer connection to your brand and will be more likely to like and trust you. If done well, the result can be increased conversions, sales, revenue, and loyalty.
Sales Forecasting
Sales forecasting is a form of prediction, generating guesses of future revenue based on past sales patterns. There are many different forms of forecasting, some of which can be mathematically complex. However, for this common business problem two relatively simple approaches are the straight-line method, and linear regression method.
Straight-Line Method
In the straight-line forecasting method, you assume a common growth rate for the item you predict. For example, you might assume a 1.5% monthly increase in revenue.
Starting with your last month’s sales revenue, you would project a 1.5% increase in each month moving forward.

The straight-line method is a fairly easy way to forecast your data. If your business is stable and growth predictable, this method can give quick results.
However, the straight-line method is also based on the simple assumption that growth is constant over time. It rarely is. Additionally, the straight-line method doesn’t consider other factors that might help predict growth or decline.
Both drawbacks can be accounted for using a linear regression method.
Linear Regression Method
In the linear regression method, a mathematical model calculates the relationship between one or more input variables and an outcome. For example, you know that monthly advertising spend is related to revenue.
Using your historical monthly ad spend and revenue, you estimate a regression model to quantify this relationship. Assuming a suitable model is obtained, you can then predict future monthly revenue based on anticipated advertising spend.

The linear regression method can include multiple factors driving your outcome and account for complex relationships such as non-constant growth.
However, linear regression also requires more data to develop a good model than simpler methods like the straight-line method. This method may require improving your data collection and tracking methods before implementation.
Equipment Maintenance
All equipment requires maintenance to continue performing at an optimal level. As an entrepreneur, unexpected downtime due to equipment failure can be disastrous. Fortunately, you can use your equipment’s maintenance schedule and simple forecasting to avoid unexpected and costly delays from this common business problem.
You begin by tracking equipment usage patterns using forecasting techniques like those described above. These could include cumulative run times, number of operations/cycles, miles driven, or other operational metrics defining when maintenance is needed.
Armed with your equipment usage trend, and maintenance schedule, you can forecast future usage to schedule timely maintenance.
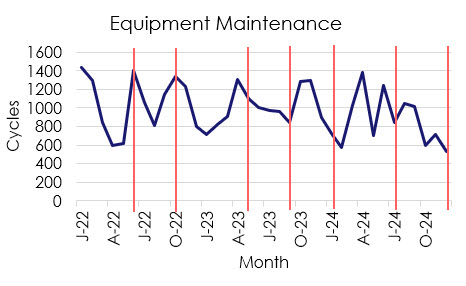
Obviously, this method won’t prevent all equipment breakdowns. However, if you identify warning signs of an impending failure (e.g., a squealing motor belt), you can adjust your forecast accordingly.
Over time, your equipment maintenance tracking will become more sophisticated with an eye for predicting failures. Your goal is to understand when failures are likely to happen and address the underlying cause in advance.
Process Efficiency
There is no clearer example of the idea that “Time is Money” than being an entrepreneur. The longer it takes for you to do anything, the less money you make.
That’s why every entrepreneur quickly learns that developing solid processes is critical for success. However, simply standing up a process is not sufficient on its own. You need to optimize your processes.
At the very least, you want to assess how long it takes you to perform certain tasks in your business. You can begin tweaking the process once you know the time required to complete the task.
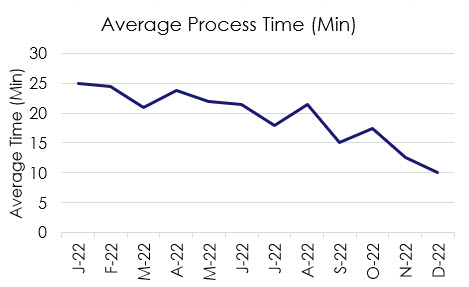
Over time, you will learn different ways of performing the same task. Those that are the most efficient and still provide a high-quality result will become your standard operating procedures (SOPs).
Process efficiency doesn’t always need to deal with how long it takes to do something. You might choose to track how many actions are completed over a period or how many errors occur. The best metric will depend on your business processes.
Customer Feedback
The creation of review sites such as Yelp, Trustpilot, and Google makes addressing customer feedback more important than ever. When combined with social media platforms like Facebook and LinkedIn, entrepreneurs face a large volume of customer feedback.
Sifting through all this feedback can be daunting for anyone, especially for time-strapped entrepreneurs. Fortunately, this is a common business problem where artificial intelligence models like ChatGPT excel.
Begin by copying the reviews you want to analyze into a single document. Upload the document to ChatGPT (Note: do not upload sensitive or proprietary data into any AI model). Then ask the model to tell you about the content and sentiments found in the reviews – positive and negative.
Of course, I recommend that every entrepreneur takes the time to read your reviews so you understand how customers feel. However, asking AI to perform a more in-depth analysis is a huge time-saver.
Conclusion
There are numerous other examples of how you can grow and scale your business with data. These are only a few examples of common business problems to get your brain juices flowing.
As you build your business, consider the metrics you’ll want to track and the data you’ll need. Prioritize your data collection so you aren’t trying to do everything all at once. You’ll make plenty of changes over time.
The most important takeaway is the understanding that you can use data to improve decision-making across every business function. The possibilities are only constrained by your imagination and the availability of data.
